Welcome to CENFACS’ Online Diary!
05 August 2026
Post No. 468

The Week’s Contents
• Trend Analysis Month with Summer 2026 Triple Pack Made of Track, Trending and Trip
• Goal of the Month and Activity/Task 8 of the Alternatives (A) Year/Project
• Metrics News as at 05/08/2026: Reporting on Metrics from CENFACS Analytics Dashboard
… And much more!

Key Messages
• Trend Analysis Month with Summer 2026 Triple Pack Made of Track, Trending and Trip
Last month, we carried out the analytics or historical analysis of the programmes, projects and activities we ran during the financial year 2025-2026. This analytics was a broad focus on using data to gain insights into these programmes, projects and activities. We also had a specific implementation of analytics and impact which applied to CENFACS.
Having this historical analysis in our mind set, we can now start looking at patterns and highlights. To do that, we are going to approach August month as a Trend Analysis Month of Triple Pack Made of Track, Trend and Trip.
Regarding trend analysis itself, we are going to focus on four areas:
a) Trend Analysis for CENFACS as a charity
b) User Activity Trend Analysis
c) Trend Analysis of the Poverty Reduction Market by following the Direction of Poverty Reduction via the Lack of Alternatives
d) Trend Analysis in Sustainable Development.
• • August as a Trend Analysis Month
After dealing with the Impact Analytics and Data Insights for the 2025-2026 Programmes, Projects and Activities in July 2026; we are now undertaking Trend Analysis this August 2026. This is because August is the month we conduct trend analysis on our work. In other words, we are statistically using techniques to identify and analyse patterns or trends in data over 2025-2026 and behind. We are examining historical data to uncover insights into past trends and predict future developments. We are now using and will be using the results of the 2025-2026 Impact Analytics and Data Insights to carry out Trend Analysis.
Trend Analysis has to be understood and defined in a technical way. Trend analysis can be approached in many ways. One of its approaches comes from ‘ideascale.com’ (1) which defines it as
“The process of evaluating past data to identify patterns and make informed predictions about future changes or behaviours. It helps organizations identify patterns, shifts, and emerging opportunities in their industry by analyzing data over a set period… It involves the examination of historical data to uncover insights into the direction or tendencies of a particular phenomenon”.
By referring to this definition, we are going to systematically examine historical data to identify patterns, tendencies, or changes over 2025-2026 and the previous financial years. Using the key performance indicators or trend analysis metrics, CENFACS trend analysts are going to capture the essence of the trends they are investigating.
• • August as the Month of Focus on Track, Trending and Trip
August is also the month we focus on CENFACS’ bundled set of three initiatives – Track, Trending and Trip. These three elements refer to
a) physical fitness event
b) social media or public awareness trends regarding economic hardship/poverty reduction
c) and field visits or voluntourism (that is, a type of tourism in which travelers participate in volunteer work) donor trips to oversee our projects.
In other words, we are on the track of poverty reduction, we walk to meet those in need, and we follow the direction of poverty reduction.
Let us briefly explain these key concepts or activities of the month making our triple pack (i.e., track, trending and trip).
• • • On the Track of Poverty Reduction
Tracking activity for a charity means recording and monitoring its operations, funds. and services to prove impact, manage supporters, and stay legal. There are many types of charity activity tracking. In this case, our activity tracking is fitness and challenge events.
We are on the Track of poverty reduction as we are looking for relief for ourselves and other people. We do Track at CENFACS as we think that every one of us can undertake basic physical activity of running or racing to help reduce poverty. This physical run can be athletic event or endurance treks used awareness or funds. In this process of tracking, we also try to reduce or eliminate poverty due to being on the wrong side of the tracks.
To basically run or race, one does not need to be part of field event. For those who cannot in-person run, they can do it virtually or online. Our project known as Run to Reduce Poverty is designed to meet that end.
This Summer, we are going to do Tracking while taking into account the treble context of the lingering impacts of the cost-of-living pressures, extreme temperatures and the damaging effects of the other polycrises.
• • • Trips or Walks to CENFACS’ Projects
August is also the month during which we carry out some Visits or Trips to our projects. It means going to see the real work any of the organisations associated with us do to help people or places in need. This lets us/you see the project site, meet those who are making positive difference on the grounds, and watch how support is used.
We visit our projects all over the year, but August is the time we highlight this. We do a short journey to one of the places in need. It is the month of the year we walk again and reach out to the need; that is, to the people, communities, organisations and livelihoods in need.
This trip to projects can also be donor or volunteer field trips (with agreement of CENFACS) to inspect or participate directly in on-the-ground community and sustainable development work.
This Summer, we are going to undertake both Virtual or In-person Trips depending on the circumstances prone to the rising costs of living, changing climate and lingering effects of the other polycrises. We can work alone or use our social network or social wayfinding or even social trail.
• • • Trendy Development
We thirdly deal with Trending in August as we spend time looking at what is popular at CENFACS in the context of poverty reduction as well as what is the current, general movement or tendency in poverty reduction. This is what we can call Trendy Development; that is a development process following the latest fashions in terms of poverty reduction.
• • • • Trending in Poverty Reduction
Trending in Poverty Reduction helps us to follow the direction of poverty reduction. This August, we are going to follow this direction or tendency of poverty (or poverty reduction) via the lack of or addressing the lack of alternatives.
In CENFACS Year of Alternatives, it makes sense to have some interest in alternative lacking or when poor people do not have alternatives in poverty reduction. Alternative lacking is explained by ‘merrian-website.com’ (2) as
“A substitute, option, or choice is missing, absent, or in short supply. It describes a situation with no other way, path or backup plan available”.
It also describes a scenario where a person or group is forced to accept a single course of action because no other plan exists.
This August, we shall not only identify this lack of alternatives in poverty reduction but also finding ways of addressing alternative lacking so that those who think or have no alternatives can understand there is always way of finding alternative that can meet their needs.
This Trend Analysis of Poverty Reduction evaluates how financial allocations, social programmes, and economic factors shift over time to impact low-income beneficiaries. Key elements include tracking funding flows, measuring programme effectiveness and identifying persistent disparities.
Besides this Trend Analysis of the Poverty Reduction Market by following the Direction of Poverty Reduction, we shall have three more trend analysis: Trend Analysis for CENFACS as a Charity, User Activity Trend Analysis and Trend Analysis in Sustainable Development.
• • • • Trend Analysis for CENFACS as a Charity
CENFACS trend analysis is the study of data and patterns in CENFACS, operations, and social impact over time. It helps CENFACS track shifts in donor behaviour, economic conditions, and demand of the services that CENFACS offers.
This second trend analysis will involve identify patterns and shifts in data to understand how CENFACS can better achieve its charity objects and mission, adapt to changing environments, and improve its impact. This is with bearing in mind that every year is learning process and never end commitment on how we can do better.
• • • • User Activity Trend Analysis
Needs, preferences and buying habits can change over time. We cannot assume that because we have been offering services to the community, our beneficiary/user needs will be always the same. This is why we need to conduct user activity trend analysis.
User Activity Trend Analysis is the practice of collecting, tracking, and evaluating how people interact with CENFACS website and system of poverty reduction in the last financial year to spot recurring patterns, shifts in behaviour and emerging anomalies.
This analysis will be about tracking user interactions with CENFACS services and analysing trends in user activity to make data-driven informed decisions. It is also about understanding past trends and anticipating future developments.
• • • • Trend Analysis in Sustainable Development
Working with Local People to Develop Sustainable Initiatives is part of CENFACS charity objects. So, conducting trend analysis in sustainable development initiatives is the systematic tracking of historical data and emerging patterns over 2025-2026 to anticipate future environmental, social and economic shifts. It helps CENFACS allocate resources wisely, manage risks, and design forward-thinking green strategies. Such analysis will include gathering metrics, pattern recognition and impact evaluation.
The above-mentioned trend analysis activities will help in generating a trend analysis report which will further up CENFACS poverty reduction work.
More details about Trend Analysis Month and CENFACS’ Track, Trending and Trips for this year are given under the Main Development section of this post.

• Goal of the Month and Activity/Task 8 of the Alternatives (A) Year/Project
Our Goal of the Month focuses on Using Trend Analysis to Find Better Alternatives in Poverty Reduction. Activity/Task 8 of the Alternatives (A) Year/Project is about Running or Walking with or Visiting the People in Need of Alternatives in Poverty Reduction. Both our Goal of the Month and Activity/Task 8 are complimentary.
Let us look at these Goal of the Month and Activity/Task 8. Let us start with Activity/Task 8.

• • Activity/Task 8 of Alternatives (‘A’) Year and Project: Run or Walk with or Visit the People in Need of Alternatives in Poverty Reduction
Our series or set of interconnected tasks or activities planned for the execution of CENFACS’ dedication of year 2026 as of Alternatives continues with the eighth activity/task. In this eighth activity or task, we are going to help meet the needs of those are looking for or asking for alternatives in poverty reduction. We are going to try to do it by physically running or walking with or visiting them.
Let us first explain the expression ‘in need of alternatives in poverty reduction’, then highlight the outcomes that can result in physically running or walking with or visiting them.
• • • Explaining Activity/Task 8 of Alternatives (‘A’) Year and Project
• • • • Meaning of ‘in need of alternatives in poverty reduction’
‘In need of alternatives in poverty reduction’ means requiring the transformation of the underlying conditions that perpetuate poverty, such as lack of education, inadequate infrastructure, health services, and limited economic opportunities.
It also involves shifting from reactive to proactive strategies (like Human Rights-based Approaches, Income Distribution and Living Wage Campaigns, Place-based and Localized Strategies).
It further encompasses looking for alternatives that focus on root causes rather than symptoms so that those in need can reduce extreme poverty levels and enhance resilience to economic shocks.
The above-mentioned explanations lead to the following understanding.
• • • • Understanding Physically Running, Walking or Visiting People in Need of Alternatives or Complements to Traditional Poverty Reduction
This refers to community outreach programmes, active volunteer-led home-visiting networks, and grassroots community companion schemes. There are different types of physical outreach and support that one can undertake, which include community outreach and home visiting, street and crisis outreach, active travel and companion schemes.
There are outcomes that can result from physically running, walking, or visiting the people experiencing hardship.
• • • • Outcomes relating to Activity/Task 8
The activity or task of physically running, walking, or visiting alongside people experiencing hardship fosters social connection, improves mental and physical well-being, and builds community trust. These participatory approaches help dismantle stigma, combat isolation, and create mutual support networks that aid long-term recovery and resource access.
• • • Illustrating Running, Walking and Visiting Activities
The following examples can help illustrate these activities.

• • • Examples of August 2026 Activities for the Year of Alternatives
To put into practice CENFACS’ Alternatives (A) Year and Project and of the month of Track, Trip and Trend; one can proceed with Alternative Activities. These are non-traditional pursuits or tasks used in place of standard practices, often focusing on choice, creativity, or specific developmental goals.
One can undertake either of the Alternative Activities given below.
• • • • Alternative Activity 8.1: Safely and Healthily Run 2.5 miles (nearly 4 km) with people in need of alternatives in poverty reduction
It is about running with them to create user-generated information giving opportunity while talking to them during the run and supporting them to improve their coping strategies for their good wellness or their alternative plans. It also means gradually building your endurance, maintaining a conversational pace, and using proper form.
• • • • Alternative Activity 8.2: Undertake Virtual or In-person Visits or Tours of 3 Alternative projects or activities
This refers to doing online or physical walkthroughs of alternative options, venues, or progammes as part of a decision-making or evaluation process. It means using digital tools or physical trips to explore different choices.
These projects or activities can be based on facts, information and skills acquired through experience or education, and which use appropriate methodology, techniques and tools to support people this Summer 2026.
For virtual visits, one can use online video, 360-degree views or digital platforms to see a place or programme from a distance.
For in-person visits, one needs to physically travel to a location to inspect or experience a programme or facility face-to-face.
• • • • Alternatives Activity 8.3: Carry out online search to find 6 Trends in poverty reduction projects
This involves looking for digital data, reports, and statistics to see how well efforts to lower poverty are working over time. It also includes using web tools to track changes in global or local living standards. These projects should be those helping people to find better alternatives in their lives/livelihoods.
The above three examples of Alternatives-based Activities are our way of linking our ‘A’ Year/Project and the month of Trend Analysis as well as of Track, Trip and Trend together.
The above is what Activity/Task 8 of the Alternatives (A) Year/Project is about. Those who would like to undertake it, they can go ahead.
For those who need some help before embarking on this activity/task, they can speak to CENFACS.
For any other queries and enquiries about the ‘A’ project and this year’s dedication, please contact CENFACS as well.

• • Goal of the Month: Use Trend Analysis to Find Better Alternatives in Poverty Reduction
Our goal for this August 2026 is to carry out basic trend analysis to identify better alternatives in poverty reduction.
Indeed, literature review on trend analysis suggests that it helps in finding alternatives by identifying patterns and shifts in data over time. Research findings on literature analysis also indicate that trend analysis and policy alternatives are directly linked because historical and projected trend data expose the failures of current trajectories, which then forces the creation and selection of alternative poverty reduction strategies. These trend analysis and policy alternatives can enable to find more suitable substitutes in poverty reduction than one may think.
• • • Trend Analysis (TA) as a Diagnostic Tool
TA can help identify stagnation and expose systematic flaws.
σ Identifying stagnation: TA evaluates whether current metrics (like Gross Domestic Product growth or standard poverty lines) are on track to meet reduction targets.
σ Exposing systematic flaws: TA shows when traditional economics growth fails to trickle down, revealing rising inequalities.
• • • Driving Policy Alternatives
This drive includes information from new models and target interventions.
σ Informing new models: It triggers shifts towards alternative paths – such as multidimensional poverty indexes, basic income guarantees, or green-transition frameworks – when traditional methods prove insufficient.
σ Targeting interventions: It guides the design of evidence-based alternative policy packages tailored to specific vulnerable groups identified in the data.
So, during this July 2026 we are going to Use Trend Analysis and Policy Options to Find Better Alternatives in Poverty Reduction. This is our Goal for the Month of August 2026.
• • • Implications for Selecting the Goal for the Month
After selecting the goal for the month, we focus our efforts and mind set on the selected goal by making sure that in our real life we apply it. We also expect our supporters to go for the goal of the month by working on the same goal and by supporting those who may be suffering from the type of poverty linked to the goal for the month we are talking about during the given month (e.g., August 2026).
For further details on the goal of the month, its selection procedure including its support and how one can go for it, please contact CENFACS.

• Metrics News as at 05/08/2026: Reporting on Metrics from CENFACS Analytics Dashboard
Before Reporting on Metrics or giving the Metrics News from CENFACS Analytics Dashboard, let us briefly explain this dashboard.
• • What Is CENFACS Analytics Dashboard?
CENFACS Analytics Dashboard is an information management tool that tracks, analyses and displays key performance indicators, poverty reduction diagnostics, poverty relief metrics/dashboards, results from CENFACS’ poverty relief league, etc.
It is an interactive graphical user interface that allows to display, track, and analyse key performance indicators (KPIs) and metrics.
It provides deeper insights into how, when, and where users can engage with CENFACS.
In the context of Metrics News, our operational analytics dashboard will give information of what is happening now. Because we are conducting 2025-2026 programmes, projects and activities, our strategic dashboard will monitor the status of KPIs related to the overall CENFACS performance.
• • Reporting on Metrics or Metrics News from CENFACS Analytics Dashboard
This Metrics News stems from CENFACS Analytics Dashboard. The news has been released to mark and close CENFACS Analytics and Impact Month 2026.
Reporting on Metrics from CENFACS Analytics Dashboard involves collecting, analysing, and presenting key performance indicators and other quantifiable data to track progress, identify trends, and make informed decisions.
It is also about using project beneficiaries’ data and analytics to understand their experiences, optimise our poverty reduction content strategy, and drive both user engagement and CENFACS’ mission and charity objects.
The news summary coming from CENFACS Analytics Dashboard covers the following areas:
Save Animals, Poverty Relief League Table, Key Performance Indicators, Poverty Reduction Diagnostics, Poverty Relief Metrics, and Repository.
Let us summarise this news.
• • • Save Animals
Key data for animal conservation in Africa includes the new challenges of poaching and habitat loss for elephants, gorillas and rhinos. These three animal species are part of CENFACS’ Big Beasts Campaign and the application of metrics in environmental (species) monitoring. As part of our campaign, we continue to ask for better protection of these beasts, in particular but not exclusively Grauer’s Gorilla. This protection involves technologies and laws.
In terms of technologies for wildlife monitoring and law enforcement, technologies like SMART camera traps and satellite tracking are good to help protect Grauer’s Gorillas by enabling real-time treat mapping, optimizing anti-poaching ranger patrols, and tracking habitat changes in remote Democratic Republic of Congo where these species are found.
In terms of field monitoring and data collection, the following technologies are useful to monitor wildlife:
σ Smartphones and cyber tracker: Rangers use rugged mobile devices to record geo-referenced data on gorilla nests, tracks, and illegal activities like snares or camps in real time
σ Camera traps: Motion-activated remote cameras capture visual evidence of hidden Gorilla groups in reserves like Tayna, verifying population health without human disturbance
σ Bioacoustics: Remote acoustic sensors listen for gunshots or illegal logging sounds in the forest canopy, sending audio patterns to researchers for rapid analysis.
Concerning law enforcement and patrol optimization, the technologies given below are used:
σ SMART Software: The Spatial Monitoring and Reporting Tool processes ranger patrol logs to map poaching hotspots and measure enforcement efficiency
σ EarthRanger Integration: Central headquarters use cloud platforms to track patrol routes and coordinates team deployments across vast, rugged terrain
σ Satellite Tracking: High-resolution satellite image monitors unauthorized forest loss, agricultural expansion, and mining camps encroaching on gorilla habits.
It emerges from the dashboard and our Africa-based Sister Organisations that the above-mentioned technologies for wildlife monitoring and law enforcement are important to protect the Grauer’s gorillas and other species animals.
• • • Poverty Relief League Table
It arises from the work of ‘mohacafrica.org’ (3) that few African nations have achieved notable success in lowering extreme poverty to single digits, specifically Mauritius and Seychelles, while North African countries like Egypt and Morocco maintain lower rates due to stronger infrastructure. However, broad or rapid poverty reduction across wider Sub-Saharan Africa remains heavily constrained in 2026 by inflation, food price volatility, and geo-spatial shocks.
Regarding extreme poverty metrics, the website ‘mohacafrica.org’ states that leading nations with lower poverty rates are
σ Mauritius which maintains extreme poverty below 3%
σ Seychelles which kept extreme poverty down to single digits
σ Equatorial Guinea and Gabon which individually registered extreme poverty metrics below 3%.
The same website recognizes that poverty is a systemic trajectory “fragility trap” affecting over 460 million lives.
Similarly, the World Bank (4) acknowledges that
“Broad poverty reduction momentum has slowed down in 2026 due to high inflation, debt burden and lingering fallout from supply and food price shifts”.
This source of information can help those who are playing CENFACS POVERTY Relief League to create their table. This table is part of Play Project, one of the All-Year-Round Projects.
• • • Key Performance Indicators
It is worth to mention two measures: measure of the relationships of inputs to outputs and of support to outcomes/impacts.
a) Relationship between inputs and outputs (or production function where Output is function of the set of three inputs: Labour, Capital and Land/Natural Resources)
This is a direct cause-and-effect link where resources are converted into immediate goods and services.
This relationship shows that between July 2025 and June 2026, CENFACS did not employ much Capital (equipment) and Natural Resources to produce its services and poverty reduction. Instead, it mostly employed volunteers as Labour or Human Services. Also, volunteer hours we spent helped to produce various advice sessions and online resources to support the community.
b) Measure of support to outcomes
This measure tracks inputs/activities against real changes.
The changes that have occurred to beneficiaries as a result of some of the projects (like Financial Controls and Monitoring 2026) have increased financial management confidence for those who took these projects seriously and showed their willingness to participate or to follow similar activities in the future. Also, the tracking of guidance sessions (support) shows that there has been better household budget management (outcome) within the community.
c) Measure of support to impact
The key frameworks relating to this measure include the theory of change, social return on investment, and direct beneficiary feedback (voice).
The news about the effectiveness of the programmes, projects and activities delivered (for instance through Advice Service) indicates that participants keep displaying progress towards achieving outcomes (e.g., their plans). Our investment in administrative costs for work carried out on behalf of beneficiaries enabled to prevent financial mismanagement from beneficiaries.
• • • Poverty Reduction Diagnostics
The systematic analysis of the factors contributing to poverty in Africa where most of CENFACS Africa-based Sister Organisations operate indicate these factors are inflation and rising costs, political uncertainty, conflicts and displacement, poor access to basic services, uneven distribution of natural and government resources, and climate change and shocks.
For instance, the website ‘ids.ac.uk’ (5) indicates that
“Widespread droughts and erratic flooding in parts of the Sahel and East/Southern Africa have decimated crop yields and livestock, plunging vulnerable rural households deeper into food insecurity”.
The diagnostic report also points out to specific issues linked to each African country and its charity sector.
• • • Poverty Relief Metrics
The poverty relief metrics found in the dashboard are the Multidimensional Poverty Index (MPI), Lived Poverty Index (LPI), Working Poverty Rates (WPR), and Metrics linked to Ebola and poverty in Africa.
MPI tracks health, education and standard of living indicators simultaneously rather than relying solely on household income.
LPI measures grassroots experiences of actual shortages, such as missing food, clean water, and medical care over a fixed period.
WPR evaluates the share of employed individuals living below the $3.00 per day threshold despite holding steady informal jobs.
Metrics News focus on Metrics Linking Ebola and Poverty in Africa (MLE&PiA). This focus reflects our interest/work on the theme of Negative Disruptions to Poverty Reduction Efforts, which made the 18th Edition of our Summer Festival.
Among MLE&PiA highlighted in the Metrics News are the following transmission and mobility metrics:
σ Infection multipliers in slums
σ Rising national poverty lines
σ Regional GDP loss.
To highlight the link between Ebola and poverty in Africa, the United Nations Development Programme (6) notes that sufferers in poor shanty towns infected 3.5 times more people than those in rich areas, and outbreaks push hundreds of thousands into poverty while costing regional economies up to US$3.6 billion.
• • • Repository
The most recent document to help users over this Summer is CENFACS 2026 Edition of Holiday with Relief. The resource focuses on Holiday with Alternative Activities. It is available for those who need it.
The above summary of Metrics News stems from CENFACS Analytics Dashboard. While providing an idea about some of the key metrics or indicators, it also gives an idea about the state of running of CENFACS analytics and health.
Those who will be interested in Reporting on Metrics or Metrics News, they should not hesitate to contact CENFACS.
Extra Messages
• All-in-one Happiness, Healthiness and Wellness Journal 2026 – Creative Activity No. 3: Create Your Double-entry Journal of Happy, Healthy and Good Life Expectancy (Journal A) and the Triple Bottom Line (Journal B)
• Impact Capture and Record Your Summer Telling Moments to Report Back, Embed Resilience and Innovation to Drive Progress
• Including the Last Square of Escape or Inescapable from Poverty (Le Dernier Carré) into the Summer-of-Happiness-Healthiness-and-Wellness Programme

• All-in-one Double-entry Journal of Happiness, Healthiness and Wellness for Summer 2026 –
Creative Activity No. 3: Create Your Double-entry Journal of Happy, Healthy and Good Life Expectancy (Journal A) and the Triple Bottom Line (Journal B)
To create an All-in-one Double-entry Journal of Happy, Healthy and Good Life Expectancy, one may need to understand the meaning of a happy, healthy and good life expectancy as well as of double-entry journal.
• • Core Concepts
• • • Happy, Healthy and Good Life Expectancy
Happy life expectancy is simply the number of years the average citizen in a country lives happily at a certain time. Healthy life expectancy estimates the number of years individuals can expect to live in very good or good health. Good life expectancy is the average life in good health.
Indeed, happiness can be associated with longer life. According to the psychologist and epidemiologist Andrew Steptoe quoted by Helen Fields (7),
“The research shows that good moods are correlated with long life, but it is not proof that happiness makes people live longer… People’s life circumstances are also relevant”.
As to healthy life expectancy, the website ‘verywellhealth.com’ (8) explains that
“Healthy life expectancy is indicative of years of wellness, not total years of life. Health-adjusted life expectancy is the average number of years that a person can expect to live in full health – that is, not hampered by disability illnesses or injuries. Commonly referred to as healthy life expectancy, it is a measurement used by the World Health Organisation in assessing the health and well-being of a country”.
Regarding a good life expectancy, the website ‘britannica.com’ (9) states that
“It is the average number of years a person is expected to live in good health or without disability, given current age-specific mortality rates and disease and disability prevalence rates”.
Knowing what a happy, healthy and good life expectancy means, one can create a journal about it.
• • • All-in-one Double-entry Journal of Happiness, Healthiness and Wellness
An all-in-one journal of happiness, healthiness and wellness is a guided personal notebook that combines emotional reflection, and goal setting into a single daily tool. It helps users manage their mental wellbeing, monitor physical routines, and practice gratitude all at once.
It is a single notebook combining daily lifestyle tracking (like food, sleep, and exercise) with two-sided reflection method (separating factual events from emotional responses) to support overall physical and mental wellbeing.
It is possible to create either or both journals.
Creating an all-in-one format replaces multiple separate notebooks in housing your meal plans, fitness logs, habit trackers, and gratitude lists in a centralized place.
Using a double-entry method splits a page or spread into parallel sections – typically using one for objective tracking or events (what you ate, house slept) and the other side for subjective analysis (your thoughts, moods, and feelings about the day).
• • Creating Your All-in-one Journal of Happy, Healthy and Good Life Expectancy
One can use the association that Steptoe made between happiness and longer life to create their journal of happy life expectancy. Such journal will be of the opportunity to live happy summer life or of the days one spent happily during Summertime.
Likewise, one can refer to the definition of healthy life expectancy to write a journal of healthy life expectancy (or disability-free life expectancy). The journal of healthy life expectancy could be a document for a self-reported health status and provide insight into the quality of life.
One can also apply the view of ‘britannica.com’ on good life expectancy and create a journal of good life expectancy.
In one’s journal, one can write things like the types of steps they can take to increase their years in good health, such as carrying out regular physical exercise, eating more plant-based foods, keeping routine doctor appointments, etc. They can as well use reliable statistics to check their life expectancy calculation (e.g., via life expectancy calculator).
One can even go further in combining happiness, healthiness and wellness to create an all-in-one journal about them. To do that one needs to understand factors determining life expectancy.
• • • Factors Determining Life Expectancy
Amongst these factors are socio-economic status, lifestyle, ethnicity, migrant status and education. One can use one or a combination of these factors and write a journal on how the selected factor(s) is/are contributing to their happiness, healthiness and wellness, therefore to their life expectancy this Summer 2026.
For instance, one can write on factors that influence their healthy life expectancy like their socio-economic status (e.g., employment, healthy lifestyles), lifestyle choices (e.g., healthy eating, smoking cessation, physical activity, alcohol free consumption, etc.), healthcare access, and environmental factors.
So, as part of Summer of Happiness, Healthiness and Wellness, one can create a journal for the things that and people who are bringing or have brought expectation of living a happy, healthy and good life during this Summer 2026.
• • Creating Your Double-entry Journal of Happy, Healthy and Good Life Expectancy
One can create a double-entry journal (a two-column reflection tool used in education, accounting, and personal introspection) with happy/healthy life expectancy (demographic metrics measuring how long people live free of pain or in a state of well-being).
If one considers personal wellness, the left side might track a daily habit or event, and the right side contains your reflection on how it affected your mood or vitality. Designing a personal wellness log, a custom double-entry layout for a good life might look like this:
σ Left Column (the Input/Action): Record a daily health or lifestyle choice (e.g., 30 minutes of walking, a whole-food meal, or a social connection)
σ Right Column (the Reflection/Well-being): Write down your subjective response – such as your energy level, sense of gratitude, or emotional happiness tied to that choice.
• • Creating Your Double-entry Journal of Happy, Healthy and Good Life Expectancy with the Triple Bottom Line (TBL)
A double-entry journal comparing human wellbeing (happy, healthy and good life expectancy) with the Triple Bottom Line is a reflective learning tool. It places individua human life quality on one side and corporate/societal sustainability on the other to see how economic actions affect actual human lives.
Let us see the two sides of this journal.
• • • The Two sides of this journal
Side A: Happy, Healthy and Good Life Expectancy
This side focuses on personal and population wellbeing, often tied concepts like ‘Years of Good Life’. It includes:
σ Survival and health: Physical and cognitive health without severe limits
σ Standard of living: Living free from poverty and basic deprivation
σ Life satisfaction: Personal happiness and emotional well-being.
Side B: The Triple Bottom Line
This side focuses on the three pillars of sustainability and societal performance. These pillars are:
σ People (Societal): It includes fair wages, community health and employee welfare
σ Planet (Environmental): It involves eco-friendly practices, waste reduction, and resource protection
σ Prosperity (Economic): It encompasses financial viability and long-term economic and inclusive growth.
• • • Connecting the Two sides of this journal
To connect the two, one needs to match impact and balance value.
σ Matching impact: One is required to use the double-entry format to link a policy action (like reducing pollution on the TBL side) directly to a human result (like increasing healthy life expectancy on the other side).
σ Balancing value: It tests whether your pursuit of prosperity and environmental care truly translates into happier, healthier, and longer lives for people.
• • Impact Capturing and Reporting Your Thoughts, Feelings, Souvenirs and Memories about Life Expectancy
People can impact capture and record their thoughts, feelings, experiences, souvenirs and memories in relation to their life expectancy or the expectation of it. They can share with the community their experience of happy, healthy and good life expectancy. This can be recorded in their journal and be shared by the end of Summer 2026.
To share the contents of their all-in-one double-entry journal of happiness, healthiness and wellness relating to happy, healthy and good life expectancy, and help build a better Summer holiday experience, they can contact CENFACS.
• Impact Capture and Record Your Summer Telling Moments to Report Back, Embed Resilience and Innovation to Drive Progress
Whether one has a Summer break or is working over this Summer, it is always a good idea to impact capture and record your memorable moments or just what you are doing.
Capturing and recording the impacts of your summer holiday moments involves preserving personal memories, reflecting on experiences, and documenting feelings. Key methods include photography, physical journaling, digital tracking, and videography.
• • Impact Capture and Record Your Summer Telling Moments as They Happen
Capture and record Summer activities (e.g., engagement activities where the people in your experience are engaged) that can lead to impact. You can look for impact when capturing and recording your Summer moments.
However, impact can be difficult to track, in particular for those who do not have experience for impact capturing and recording. You can keep track of the people who are participating in your Summer experiences.
For those who are not familiar with impact capturing and recording, they can take these basic actions:
∝ Look for different types of impact
∝ Use various leads and mediums of finding and mapping impact
∝ Appeal to indicators for impact
∝ Refer to impact capturing and recording tools
∝ Decide what you need to track for your impact
∝ Use Artificial Intelligence or ChatGPT support to assist you to impact capture and record
etc.
These basic actions will enable them to create an impact record.
After Summer, we often ask our project beneficiaries or the community to impact report their Summer experience back. If you impact record what you are doing this Summer, after Summer it will be easier to share what you may judge is a shareable part of your Summer experience or story.
• • Do not Forget to Take Photos and Pictures, Make a Video, Record Your Voice, Podcast, etc.!
If you decide to impact capture and record your Summer activities or experiences, please do not forget to take photos and pictures, make a video, record your voice, podcast, etc. It is also useful to write down dates, places and names of people involved in your Summer projects or experiences. You can plan the way you want to impact report back, whether you want to use words or numbers or voices or information graphics (e.g. tables or graphs, figures, etc.) or videos or short films.
Before including people around you in your recorded experience, please take care of General Data Protection Regulations. This extra care will help to protect yourself and others. If necessary, please check the policy on handling people’s information and data, including update on this policy.
• • Ways of Impact Capturing and Recording Your Summer Telling Moments
They include the means given below.
• • • Visual and Audio Documentation (Sensory Recording)
They involve
σ Candid photos: Snap shots of real laughter, food and small details instead of only posing
σ Digital cameras and smartphones: Take high-resolution photos and short videos
σ Short video clips: Record 5 to 10-second clips of moment, sounds, and daily atmosphere
σ Audio logs: Record ambient sounds like waves, birdsong, or bustling markets
σ Voice memos: Record sounds of nature or quick spoken thoughts.
• • • Physical Memorabilia and Digital Keepsakes
They include
σ Travel journals: Write down daily thoughts, funny quotes, and feelings alongside your pictures
σ Physical books: Compile your best digital snapshots into a yearly photo book or custom calendar
σ Souvenir collection: Keep small legal items like postcards or local currency coin.
• • • Digital and Social Apps
They encompass
σ Shared cloud albums: Upload pictures instantly for friends and family to see
σ Mapping tools: Drop digital pins on places you visit online map apps
σ Blog posts: Write public or private online stories about your daily path.
You can also consider metrics.
• • Metrics for Impact Capturing and Recording Your Summer Telling Moments
They include emotional resonance, sensory depth and memory retention.
σ Emotional metrics are, for instance, joy peak level and gratitude count.
σ Sensory and memory metrics can include sensory richness, detail retention, story value, etc.
These core measures help you track how deeply an experience affects you and how well it stays in your mind over time.

• • Impact Reporting Back Your Summer Experiences to Embed Resilience and Innovation to Drive Progress
Impact reporting back your experiences can sometimes inspire others, especially if your experiences contain interesting poverty-relieving features or outcomes. Sometimes what you may think is not important in your life experience could be very useful or even life-saving for others in the community. Your experiences could help to embed resilience and innovation to drive progress.
We hope you will seriously take our message of impact capturing and recording to impact report back, embed resilience and innovation to drive progress over this Summer.
Thank you!
• Including the Last Square of Escape or Inescapable from Poverty (Le Dernier Carré) into the Summer-of-Happiness-Healthiness-and-Wellness Programme
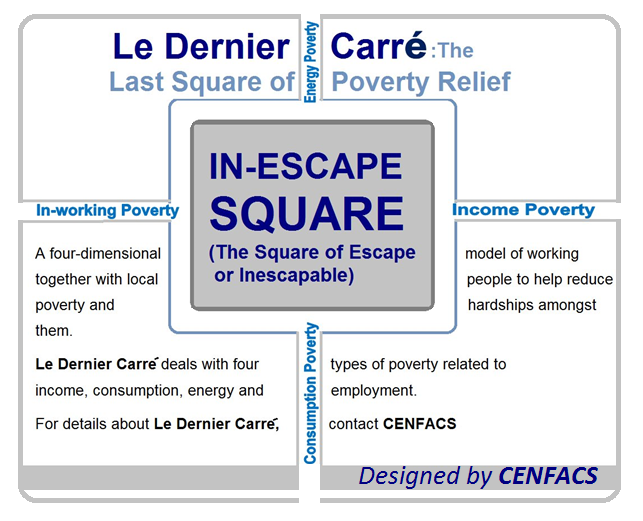
Our four step model of poverty relief (that is the Last Square of Poverty Relief or Le Dernier Carré) is included in some of the elements of the Summer-of-Happiness-Healthiness-and-Wellness Programme.
Let us explain the Dernier Carré Model, its inclusion into the Summer-of-Happiness-Healthiness-and-Wellness Programme and the key strategies for using it.
• • Le Dernier Carré Model or the Last Square of Poverty Relief or the Square of Escape and Inescapable from poverty
It is CENFACS’ a four-dimensional model of working together with local people to help reduce amongst them four types of poverty respectively related to elements:
Income, consumption, energy and employment.
Through this theoretical model, it is possible to know if an individual has reached the four types of poverty, which are: income poverty, consumption poverty, energy poverty and in-working poverty. In order to do that, we use the appropriate metrics relating to each of these types as follows.
For income poverty, we would use income-based measure of income poverty like the total resources available as defined by the Social Metrics Commission (10). We are going to refer to social and economic metrics of weekly total resources available, particularly the metrics of inescapable family-specific costs, as provided by the Social Metrics Commission (op. cit.) which explains that this metrics includes:
“recurring housing costs, childcare costs, extra cost of disability, social care costs, others [other costs] that require more research/might apply in different countries (e.g. travel-to-work, energy, healthcare)” (p. 20).
Regarding consumption poverty, we shall call to food poverty line, which is defined by ‘devinit.org’ (11) as “the cost of a basket of food with minimum recommended nutritional intake”. This metrics can be used to quantify consumption poverty.
Concerning energy poverty, we shall turn to energy poverty line, which is “the sensitivity of the energy to household income as an indicator to identify the energy poverty”, according to Lu Jiang et al. (12).
As to in-working poverty, we shall consider “household equivalised disposable income below 60 per cent of the national household median” as specified by Abigail McKnight et al (13).
All these quantitative measures will be involved in the theory of the last square of poverty relief and help to determine a 4-dimensional poverty. We can as well refer to the squared poverty gap index; in which case we can assess the depth and severity of poverty, particularly by prioritizing the poorest ones within our community.
• • Including The Square of Escape or Inescapable from Poverty into the Summer-of-Happiness-Healthiness-and-Wellness Programme
We can make a final push to reach the members of our community who are struggling to have access to basic necessities and opportunities to enjoy a happy, healthy and good Summer. We can work with them to address the most severe forms of income poverty, energy poverty, consumption poverty and in-work poverty via the application of theory of the last square of poverty relief.
In the context of happiness, healthiness and wellness; the model will help us to establish if there are options to find happiness, healthiness and wellness, as well as how to remove barriers to them.
• • Core Integration Strategies for Using This theory into the Summer-of-Happiness-Healthiness-and-Wellness Programme to Reduce Poverty
These strategies are plans/ways to connect the four dimensions of poverty, ways of reducing them and the Summer-of-Happiness-Healthiness-and-Wellness Programme. The following illustrats how these connections can be done.
Concerning consumption poverty, advice and guidance can be given about Holiday Food Provision to tackle holiday hunger when free school meals stop. Key strategies involve integrating holiday food security, low-cost cooling and energy efficiency, and community activities.
Regarding energy poverty, tips and hints can be provided to energy poor to mitigate summer energy poverty by educating households on low-cost ways to handle indoor heat without driving up electricity bills from fans. The focus will be on keeping homes cool, lowering utility bills, and offering financial energy advice and green social prescribing.
As to income poverty, guidance can be given to families looking for free-of-charge summer activities (like play sessions, fitness, nature, and arts activities) or subsidized childcare. The focus will be on free access, cash support and job skills development.
With respect to in-working poverty, low-income working parents can be offered confidential financial planning or benefit check/entitlement. The focus will be zero-fee entry activities, free lunch programmes and free essentials.
These strategies show how barriers can be removed from poor households and families to enjoy summer with happiness, healthiness and wellness. They will enable them to find their route/path to escape from the 4-dimensional poverty encapsulated in the theory of the last square of poverty relief.
Those who would like to work with CENFACS reduce the types of poverty making the last square of poverty relief, they should not hesitate to contact CENFACS.
Message in English-French (Message en Anglais-Français)

• CENFACS’ be.Africa Forum E-discusses the Following Topic:
Commercial Sports Industry and Poverty Reduction in Africa
Commercial sports industry can play an increased role in reducing poverty in Africa. To understand how it can increase its poverty-reducing role, it is better to know it, its size and what it can do more from what it is already doing in Africa.
• • Commercial Sports Industry in Africa: Its Definition, Objective, Size, Market Overview and Value, Areas and Key Partners
According to ‘humankinetics.com’ (14),
“The commercial sports industry is the economic sector composed of businesses and organizations that operate to generate profit through sports, including broadcasting, sponsorships, and merchandise sales”.
Its primary objective is economic output, elite talent generation and entertainment. It targets elite athletes, paying audiences, and tech-focused consumers. Key areas of the commercial sports industry include media and broadcasting, corporate sponsorship, merchandising and retail, event management and ticketing. In Africa, key partners are CAF, NBA Basketball Africa League (BAL), and private media.
In terms of current value, the African Sports and Creative Institute (15) explains that
“The commercial sports industry is valued at roughly $12 billion to $14 billion annually contributing about 0.5% to the continent’s total Gross Domestic Product and is projected to expand past $20 billion by 2035”.
According to Forbes Africa (16), the distribution of this market value is $4.5 billion in Southern Africa, $3 billion in East and Central Africa, and $0.2 billion in West Africa. There are major events that make this value, such as Africa Cup of Nations, the upcoming 2030 FIFA World Cup and the Youth Olympic, the Basketball Africa League.
• • Commercial Sports Industry as Poverty Reducer
The commercial sports industry has the potential to reduce poverty further in Africa. It can do by investing in grassroots infrastructure, funding local vocational training and expanding equitable career pipelines. It can also do it by driving local job creation, investing in regional infrastructure, and building sustainable business ecosystems and models.
Africa’s youth population is around 60% which is under the age of 25. This suggests that there is another potential for the development of sports and the possibilities of reducing poverty in Africa. However, there is a structural hurdle as Africa accounts for less than 5% of global media rights value. This indicates that there is a need to improve commercial structure in order to increase the capacity of the Commercial Sports Industry to reduce poverty in Africa.
So, key strategies can include localizing manufacturing, developing media rights markets, and partnering with development finance institutions.
As part of this week’s e-discussion, we are looking at the possibilities for the commercial sports industry to further reduce poverty in Africa since it has the potential to do so.
The above makes our e-discussion for this week while providing materials and space for reflection, expression, discussion and action.
Those who may be interested in reflection, expression, discussion and action on ‘Commercial Sports Industry and Poverty Reduction in Africa’ can join our poverty reduction pundits and/or contribute by contacting CENFACS’ be.Africa Forum, which is a forum or space for discussion on poverty reduction and sustainable development issues in Africa and which acts on behalf of its members by making proposals or ideas for actions for a better Africa.
To contact CENFACS about this discussion, please use our usual contact address on this website.
• Le Forum ‘Une Afrique Meilleure’ de CENFACS discute en ligne le sujet suivant :
L’Industrie du Sport Commercial et la Réduction de la Pauvreté en Afrique
L’industrie du sport commercial peut jouer un rôle accru dans la réduction de la pauvreté en Afrique. Pour comprendre comment elle peut renforcer ce rôle, il convient d’en appréhender la nature, l’envergure et le potentiel d’action au-delà de ses activités actuelles sur le continent.
• • L’industrie du sport commercial en Afrique : définition, objectifs, envergure, aperçu du marché et valeur, domaines d’activité et partenaires clés
Selon « humankinetics.com » (14),
« L’industrie du sport commercial est le secteur économique composé d’entreprises et d’organisations dont l’activité vise à générer des profits grâce au sport, notamment par la diffusion, le sponsoring et la vente de produits dérivés ».
Ses objectifs principaux sont la création de valeur économique, le développement de talents d’élite et le divertissement. Elle cible les athlètes de haut niveau, le public payant et les consommateurs/rices féru(e)s de technologie. Les domaines clés de cette industrie comprennent les médias et la diffusion, le sponsoring d’entreprise, le merchandising et la vente au détail, ainsi que l’organisation d’événements et la billetterie. En Afrique, les partenaires clés sont la CAF (Confédération Africaine de Football), la Ligue Africaine de Basket-ball de l’Association Nationale de Basket-ball (NBA) et les médias privés.
En termes de valeur actuelle, selon l’Institut Africain du Sport et de la Création (15) :
« L’industrie du sport commercial est évaluée entre 12 et 14 milliards de dollars par an, contribuant à hauteur d’environ 0,5 % au produit intérieur brut (PIB) total du continent, et devrait dépasser les 20 milliards de dollars d’ici 2035 ».
D’après Forbes Afrique (16), la répartition de cette valeur de marché s’établit comme suit : 4,5 milliards de dollars pour l’Afrique Australe, 3 milliards pour l’Afrique de l’Est et du Centre, et 0,2 milliard pour l’Afrique de l’Ouest. Cette valeur repose sur des événements majeurs tels que la Coupe d’Afrique des Nations, la future Coupe du Monde de la FIFA 2030, les Jeux Olympiques de la Jeunesse et la Ligue Africaine de Basket-ball.
• • L’industrie du sport commercial comme levier de réduction de la pauvreté
L’industrie du sport commercial a le potentiel de réduire davantage la pauvreté en Afrique. Elle peut y parvenir en investissant dans des infrastructures de proximité, en finançant la formation professionnelle locale et en développant des parcours de carrière équitables. Elle peut également y contribuer en stimulant la création d’emplois locaux, en investissant dans des infrastructures régionales et en bâtissant des écosystèmes et des modèles économiques durables.
En Afrique, les jeunes de moins de 25 ans représentent environ 60 % de la population. Cela laisse entrevoir un potentiel supplémentaire pour le développement du sport et la réduction de la pauvreté sur le continent. Toutefois, un obstacle structurel subsiste : l’Afrique ne représente que moins de 5 % de la valeur mondiale des droits médiatiques. Il est donc nécessaire d’améliorer les structures commerciales afin de renforcer la capacité de l’industrie du sport commercial à contribuer à la réduction de la pauvreté en Afrique.
À cet égard, des stratégies clés pourraient inclure la localisation de la production, le développement des marchés des droits médiatiques et l’établissement de partenariats avec des institutions de financement du développement.
Dans le cadre de la discussion en ligne de cette semaine, nous examinons comment l’industrie du sport commercial peut davantage contribuer à réduire la pauvreté en Afrique, compte tenu du potentiel dont elle dispose.
Ces éléments constituent le fondement de notre discussion en ligne de cette semaine, tout en offrant un espace propice à la réflexion, à l’expression, aux échanges et à l’action.
Les personnes intéressées par la réflexion, l’expression, la discussion et l’action au tour du sujet
‘L’industrie du sport commercial et la réduction de la pauvreté en Afrique’
peuvent (re)joindre notre groupe d’experts sur la réduction de la pauvreté et/ou contribuer en contactant le ‘me.Afrique’ du CENFACS (ou le Forum ‘Une Afrique Meilleure’ de CENFACS), qui est un forum ou espace de discussion sur les questions de réduction de la pauvreté et de développement durable en Afrique et qui agit au nom de ses membres en faisant des propositions ou des idées d’actions pour une Afrique meilleure.
Pour contacter le CENFACS au sujet de cette discussion, veuillez utiliser nos coordonnées habituelles sur ce site Web.

Main Development
• Trend Analysis Month with Summer 2026 Triple Pack Made of Track, Trending and Trip
Our systematic examination of historical data that shaped our 2025-2026 programmes, projects and activities is taking place as we are trying to identify patterns, tendencies, or changes from them. While we are doing this, we are focusing on our thematic model of Summer of Happiness, Healthiness and Wellness through the three activities of…
1) TRACK to help reduce poverty
2) Virtual or In-person TRIPS to projects and locals
3) TREND analysis.
The following headings provide the contents/summaries of the Trend Analysis Month and the above-mentioned activities of the month making our Triple Pack (i.e., track, trend and trip):
∝ Trend Analysis Month 2026
∝ Summer 2026 Triple Pack Made of Track, Trending and Trip
∝Track, Trip and Trend Analysis 2026 Activities
∝ Key Metrics for Summer 2026 Triple Pack
∝ August 2026 Trend Analysis Activities/Programme
∝Trend Analyses from Wednesday 05/08/2026
Let us uncover what is inside these headings.
• • Trend Analysis Month 2026
Our August 2026 trend analysis consists of tracking data for the services we provided during the financial year 2025-2026 to identify seasonal trends or changes in project beneficiaries’ preferences. It is also about examining historical poverty reduction rates where our Africa-based Sister Organisations operate to discover trends and understand the improvement made in the conditions of those living in poverty there.
During this analysis, we shall use metrics like
performance against mission, growth of our services, opt-in growth, user happiness, impact, giving methods of donors, business basics, etc.
We will look at trends from supporters, users and beneficiaries. We will measure services, project beneficiaries’ and users’ perception. We will check whether or not we are meeting our targets, programme outcomes and stakeholder/volunteer engagement. We shall examine if we are keeping supporters, beneficiaries and users informed and engaged in CENFACS’ work.
Based on the 2025-2026 and past performance or behaviour of our charitable work, we can make informed decisions and predictions.
• • Summer 2026 Triple Pack Made of Track, Trending and Trip
CENFACS’ Triple Pack is bundled set of three initiatives – Track, Trending and Trip. These three elements refer to the following:
a) Physical run event (Track): This could be an athletic event or endurance treks used to raise funds and awareness;
b) Social media or public awareness trends regarding economic hardship/poverty reduction (Trending): This poverty reduction trending can be an online advocacy, viral campaigns, or policy focus areas centred on lowering poverty rates and addressing the cost-of-living hardship.
c) and field visits or voluntourism (that is, a type of tourism in which travelers participate in volunteer work) donor trips to oversee our projects (Trip): It involves donor or volunteer field trips to inspect or participate directly in on-the-ground community development work.
In other words, we are on the track of poverty reduction, we walk to meet those in need, and we follow the direction of poverty reduction.
Let us explain these Triple Pack activities.
• • Track, Trip and Trend 2026 Activities
• • • Track to Help Reduce Poverty
This is delivered through the project Run to Reduce Poverty, Gaming to Reduce Poverty and Vote Your African Manager of Poverty Reduction. These are All-Year-Round Projects.
However, because of the weather conditions (sunshine) and nature of August (holiday time for many of our project beneficiaries and supporters) we put a particular emphasis on the Run aspects of these all-year-round projects, over this month. One can do physical run out and indoor while bearing in mind the lingering effects of the health risk and rising temperatures.
We expect those who sign up to the Run element to take actions and run it by themselves while following to letter any health and safety rules (e.g. Protection against the lingering effects of any health risk) relating to this element. After summer or at any convenient time before the end of the year, we can all report back our individual Run activity and achievements.
• • • Virtual or In-person TRIPS to Projects and Locals
This is the second aspect of our Summer 2026 Triple Pack or part of work over the month of August at CENFACS. We expect and advise our supporters to visit some of our projects and initiatives whether in the UK or in Africa during and around the month of August.
For those who cannot in-person or physically visit projects on the grounds, arrangements can be made between the prospective visitors and the organisations to be visited so that they can organise a virtual trip, tour or viewing.
This requires that the visitors and visiting organisations have the technology that enables this virtual tour to happen. If this is possible, we expect and advise our supporters to virtually visit some of projects and initiatives whether in the UK or in Africa during and around the month of August.
a) Visits to Projects/Initiatives within the UK
This year, Trip to the needs or Visit will help to see how events such as extreme temperatures, the polycrises and the high costs of living have affected local people and local needs. During the Visit, we shall have the opportunity to see in real life how these people are strategically coping to manage these events.
b) Trips to Projects/Initiatives in Africa
Trip to the need and project includes some of the experiences undertaken by CENFACS’ All-in-Development Volunteers through field work involvements and project visits, to reach out to unreached, underserved and unserved people and communities, particularly those living in remote areas of Africa. It is the kind of experiences or expeditions or study tours that we recommend to future invertebrate and vertebrate volunteers to have and report back in September or after. When reporting back, they can evaluate and assess the effectiveness of field trips.
These trip activities, which can be done in-person or virtual, also help us to check if we are on the right track at helping to reduce poverty and at tracking our records for the work on the ground.
The theme of trending for this Summer is about the lack of or addressing the lack of alternatives in poverty reduction.

• • • Trend Analysis 2026 Activities
As shortly explained in the Key Messages, we are going to conduct four types of trend analysis:
a) Trend Analysis for CENFACS as a charity
b) User Activity Trend Analysis
c) Trend Analysis of the Poverty Reduction Market by following the Direction of Poverty Reduction via the Lack of Alternatives
d) Trend Analysis in Sustainable Development.
Let us explain what each analysis will cover.
• • • • Trend Analysis for CENFACS as a charity
This trend analysis will involve identify patterns and shifts in data to understand how CENFACS can better achieve its charity objects and mission, adapt to changing environments, and improve its impact. This includes fundraising trends, donor engagement, service demand and delivery, and operational efficiency.
Table 1 provides the delivery plan for this trend analysis.

• • • • User Activity Trend Analysis
User Activity Trend Analysis will be about tracking user interactions with CENFACS services and analyse trends in user activity to make data-driven informed decisions. It is also about understanding past trends and anticipating future developments. According to ‘userpilot.com’ (17),
“A user activity trend is a behaviour pattern observed over specific duration. Monitoring user activity trends helps keep up with your user’s growing needs and preferences. It offers a vital glimpse into how they interact with your product”.
Table 2 gives the delivery plan for this trend analysis.

• • • • TRENDING in Poverty Reduction by Following the Direction or Tendency of Poverty Reduction via the Lack of or Addressing the Lack of Alternatives.
Sustainable development does not need to be trendy, but we can follow the latest fashions in sustainable development and poverty reduction.
This August, we are dealing with Trend in poverty reduction by following or studying the direction in which poverty reduction data is moving over time via the lack of or addressing the lack of alternatives. We simply mean by that we are following the direction of poverty reduction via the lack of or addressing the lack of alternatives.
Table 3 gives the delivery plan for this trend analysis.

• • • • Trend Analysis in Sustainable Development
Working with Local People to Develop Sustainable Initiatives is part of CENFACS charity objects. So, conducting trend analysis in sustainable development initiatives is the systematic tracking of historical data and emerging patterns over 2025-2026 to anticipate future environmental, social and economic shifts. It helps CENFACS allocate resources wisely, manage risks, and design forward-thinking green strategies. Such analysis will include gathering metrics, pattern recognition and impact evaluation.
Table 4 gives the delivery plan for this trend analysis.

• • Key Metrics for Summer 2026 Triple Pack
The key metrics for our Summer 2026 Triple Pack comprising a physical run, poverty reduction trending, and field project trips are participation conversion rates, poverty reduction indicator velocity, and field visit feedback scores. These metrics of the components of Triple Pack can be expressed in the ways given below.
• • • Physical Run Metrics
They include
σ Participant Sign-up and Conversion: It is expressed as the total of registered runners, registration drop-off rates, and event-to-donor conversion percentages
σ Financial Return: It encompasses gross funds raised, cost per pound raised, and overall event return on investment
σ Engagement and Reach: It involves social media shares, team creation counts, and average individual fundraising page totals.
• • • Poverty Reduction Trending Metrics
They are
σ Indicator Velocity: It is year-over-year or month-over-month percentage changes in local household financial stability, food bank usage frequencies, or multidimensional poverty indicators;
σ Intervention Reach: It is the total number of unique beneficiaries served and the programmatic cost per beneficiary;
σ Trend Sustainability: It is calculated as multi-year compound annual growth rate of resource distribution versus community need.
• • • Trip-to-Projects Metrics
They include
σ Visitor Satisfaction and Advocacy: It involves participant post-trip feedback scores, net promoter ratings, and secondary fundraising yield from attendees post-visit;
σ Operational Efficiency: It is formulated as cost per field delegation member versus direct funds unlocked or pledged during the trip;
σ Impact Transparency: It encompasses the number of documented case studies, media assets captured, and local community testimonials recorded for stakeholder reporting.
The above-mentioned metrics will reveal trends and turn raw data into clear facts to show what we did and what needs improvement within CENFACS.
• • August 2026 Trend Analysis Activities or Programme
As argued, the above-mentioned three tables (table 1, 2, 3 and 4) provide the delivery plan for each trend analysis (that is, Trend Analysis for CENFACS as a Charity, User Activity Trend Analysis, Trend Analysis of the Poverty Reduction Market by following the Direction of Poverty Reduction via the Lack of or Addressing the Lack of Alternatives, and Trend Analysis in Sustainable Development Initiatives).
These above-crafted tables summarise our August 2026 plan of work from every Wednesday of August 2026. The focuses for the first trend analyses which starts from today Wednesday 05/08/2026 are given below.
• • Trend Analyses from Wednesday 05/08/2026
The first focuses of 2026 Summer trend analysis activities are given below.
• • • Trend Analysis for CENFACS as a charity –
In Focus from Wednesday 05/08/2026: Fundraising Trends
We are going to examine CENFACS fundraising patterns over time to forecast future developments. To do that, we are going to examine donor behaviour, fundraising sources, and cost-effectiveness of fundraising methods employed by CENFACS. Let us say few words about each of the elements of fundraising trends.
Regarding donor behaviour, we shall analyse donation patterns (e.g., amount and frequency) to see if they can reveal insights into donor preferences, and inform fundraising strategies whether to focus on community engagement or online fundraising efforts.
Concerning fundraising sources, we shall track the proportion of income from different sources (e.g., individual donations, grants, etc.) so that to identify areas of growth and areas where diversification is needed.
As to cost-effectiveness of fundraising methods, we shall evaluate the cost per pound raised for different fundraising activity (e.g., direct mail, Twitter campaigns, and events) in order to optimise resource allocation.
Briefly, this fundraising trend analysis will help to take better fundraising action, develop and implement a better fundraising strategy for the future.
• • • User Activity Trend Analysis –
In Focus from Wednesday 05/08/2026: Identification of User Preferences
It is about getting the idea of what users expect and need from CENFACS services. Knowing their preferences, it is possible to improve their experience, increase CENFACS productivity, enhance the accessibility to CENFACS services, strengthen user engagement, and improve future service design and development.
Briefly, by identifying and implementing user preferences we can create more engaging, efficient, appealing and accessible poverty reduction experiences.
• • • Trend Analysis of the Poverty Reduction Market by following the Direction of Poverty Reduction via the lack of or addressing the lack of alternatives –
In Focus from 05/08/2026: Debt and Policy Conditionality
We are going to look at systemic and structural constraints, in particular debt and policy conditionality, in Africa where our Africa-based Sister Organisations operate. These constraints affect them and their project beneficiaries, including the poverty reduction results.
Indeed, International financial frameworks often tie emergency debt relief to strict austerity, privatization, and trade liberalization, leaving governments with narrow fiscal space to design independent or localized social programmes.
By following the direction of debt and policy conditionality, it is possible to identify constraints that reduce or remove alternatives to reduce poverty for the people whose government is under debt and policy conditionality prescriptions. Heavy reliance on standardized, top-down macroeconomic prescriptions such as debt and policy conditionality can bring severe structural constraints that limit flexible policymaking and any alternatives to reduce and end poverty in Africa.
Briefly, it is feasible to observe or follow the journey of poverty reduction via the debt and policy conditionality in Africa. To follow with us the direction of poverty reduction via the lack of or addressing the lack of alternatives and in particular debt and policy conditionality, please contact CENFACS.
• • • Trend Analysis in Sustainable Development –
In Focus from Wednesday 05/08/2026: Environmental Impact
It is about tracking and revealing trends regarding environmental impact for sustainable development initiatives carried out by our Africa-based Sister Organisations in Africa. This tracking and evaluation will include carbon and energy tracking, and resource management.
σ Carbon and energy tracking: It includes monitoring energy use, reducing greenhouse gas emissions, and shifting to renewable supplies. The tracking needs to reveal if these reduction and shifts have occurred or not.
σ Resource management: It involves evaluating waste reduction, recycling practices, and supply chain sustainability.
In brief, we shall consider the sustained direction of sustainability metrics (like carbon reduction) in the design and implementation of sustainable development initiatives in Africa.
The above is our trend analysis work from Wednesday 05/08/2026; work which has already started.
For any queries and/or enquiries about the Trend Analysis Month, please do not hesitate to communicate with CENFACS.
_________
• References
(1) https://ideascale.com/blog/what-is-trend-analysis (accessed in August 2026)
(2) https://www.merrian-website.com (accessed in August 2026)
(3) https://mohacafrica.org/poverty-rate-in-africa/ (accessed in August 2026)
(4) https://openknowledge.worldbank.org/entities/publication/05fbca68-8800-4de7-8137-679ce7ecc5b2 (accessed in August 2026)
(5) https://www.ids.ac.uk/news/climate-resilience-and-poverty-reduction-must-go-hand-in-hand-in-africa/ (accessed in August 2026)
(6) https://www.undp.org/press-releases/ebola-outbreak-could-push-nearly-one-million-more-people-poverty-and-cost-africa-billions-warns-un-development-programme (accessed in August 2026); https://www.undp.org/africa/publications/socio-economic-impact-ebola-virus-disease-west-africa (accessed in August 2026)
(7) https://www.science.org/content/article/happiness-associated-longer-life (accessed in August 2024)
(8) https://www.verywellhealth.com/understanding-healthy-life-expectancy-2223919 (accessed in August 2024)
(9) https://www.britannica.com/science/life-expectncy (accessed in August 2024)
(10) https://socialmetricscommission.gov.uk/wp-content/upload/2020/06/Measuring-Poverty-2020-Web.pdf (accessed in February 2022)
(11) https://www.devinit.org/org/resources/food-poverty-global-regional-and-national/# (accessed in February 2022)
(12) Lu Jiang, Lu Yu, Bing Xue, Xing pen Chan, Zhifu Mi: Who is energy poor? Evidence from the least developed regions in China
(13) McKnight, A., Stewart, K., Himmelivert, S, & Palillo, M. (2016), Low Pay and In-work Poverty: Preventative Measures and Preventative Approaches, Evidence Review, May 2016
(14) https://us.humankinetics.com/blogs/excerpt/contemporary-sport-management-csm-sport-industry-sectors-model?srsltid=AfmBOorUX61_Zoheo_4ot07N-TBKnlay-NV7fe5J8yOFyL5Aqcp3_wH (accessed in August 2026)
(15) https://africansci.com/up-content/uploads/2025/02/ASCI-SinN-Report.pdf (accessed in August 2026)
(16) https://www.forbesafrica.com/sport/2024/09/26/africas-sporting-boom-spotlight-on-the-continent-potential (accessed in August 2026)
(17) https://userpilot.com/blog/user-activity-trend/#:~:text=… (accessed in August 2025)
_________
• Help CENFACS Keep the Poverty Relief Work Going This Year
We do our work on a very small budget and on a voluntary basis. Making a donation will show us you value our work and support CENFACS’ work, which is currently offered as a free service.
One could also consider a recurring donation to CENFACS in the future.
Additionally, we would like to inform you that planned gifting is always an option for giving at CENFACS. Likewise, CENFACS accepts matching gifts from companies running a gift-matching programme.
Donate to support CENFACS!
FOR ONLY £1, YOU CAN SUPPORT CENFACS AND CENFACS’ NOBLE AND BEAUTIFUL CAUSES OF POVERTY REDUCTION.
JUST GO TO: Support Causes – (cenfacs.org.uk)
Thank you for visiting CENFACS website and reading this post.
Thank you as well to those who made or make comments about our weekly posts.
We look forward to receiving your regular visits and continuing support until the end of 2026 and beyond.
With many thanks.